|
Size: 391
Comment:
|
Size: 1465
Comment:
|
| Deletions are marked like this. | Additions are marked like this. |
| Line 1: | Line 1: |
| | [[e2display|Display Basics]] | [[EMAN2/Programs/emselector|EMAN2 File Browser]] | [[EMAN2/Programs/emimage2d|2D Display]] | [[EMAN2/Programs/emimagemx|2D Stack Display]] | [[EMAN2/Programs/emimage3d|3D Image Display]] |[[EMAN2/Programs/e2eulerxplor|Euler Tool]] | [[EMAN2/e2displayfag|e2display FAQ]] | | | [[e2display|Display Basics]] | [[EMAN2/Programs/emselector|EMAN2 File Browser]] | [[EMAN2/Programs/emimage2d|2D Display]] | [[EMAN2/Programs/emimagemx|2D Stack Display]] | [[EMAN2/Programs/emimage3d|3D Image Display]] | [[EMAN2/Programs/e2eulerxplor|Euler Tool]] | [[EMAN2/e2displayfag|e2display FAQ]] | = EMAN2's EulerXplor Tool = |
| Line 4: | Line 7: |
| || The four interfaces of e2eulerxplor || | || The four interfaces of e2eulerxplor. See the table below for more details || || '''Table Label''' || '''Description''' || || A || This is a graphical depiction of orientations on the asymmetric unit. Click on one of the dots to display the associated class average and projection as shown in C. The color of the dot in the asymmetric unit shows the relative number of particles in the class: Blue indicates a class with a lot of particles in it, red indicates a class with few particles in it. White is in between.|| || B || This is main inspector, this appears when you middle click on A. You can select different refinement iterations to investigate how the class averages and aligned particles are changing through time. || || C || Projection (left) and class average corresponding to selected orientation (yellow) in A || || D || Aligned particles that formed the class average shown right in C. If you select the projection (left) in C these particles will be shown unaligned. Blue squares indicate that the particle did not make in into the final class average || |
| Display Basics | EMAN2 File Browser | 2D Display | 2D Stack Display | 3D Image Display | Euler Tool | e2display FAQ |
EMAN2's EulerXplor Tool
|
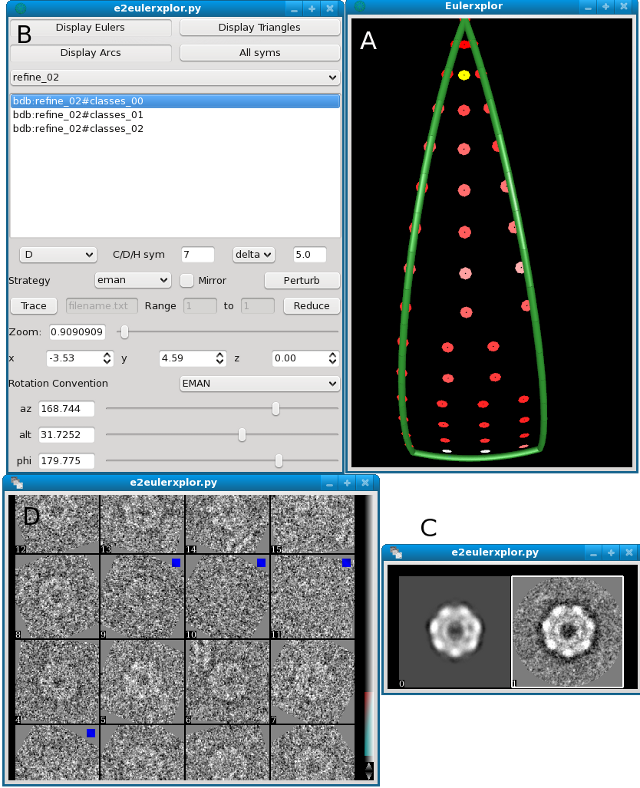
The four interfaces of e2eulerxplor. See the table below for more details |
Table Label |
Description |
A |
This is a graphical depiction of orientations on the asymmetric unit. Click on one of the dots to display the associated class average and projection as shown in C. The color of the dot in the asymmetric unit shows the relative number of particles in the class: Blue indicates a class with a lot of particles in it, red indicates a class with few particles in it. White is in between. |
B |
This is main inspector, this appears when you middle click on A. You can select different refinement iterations to investigate how the class averages and aligned particles are changing through time. |
C |
Projection (left) and class average corresponding to selected orientation (yellow) in A |
D |
Aligned particles that formed the class average shown right in C. If you select the projection (left) in C these particles will be shown unaligned. Blue squares indicate that the particle did not make in into the final class average |

